Power BI - User Interaction Report
This company approached us having gone through a huge change in their ways of working as a result of the COVID-19 pandemic. This huge shift was new to them and they wanted to not just monitor, but gain insights from and felt Power BI, given their infrastructure was the way to proceed. We worked with key stakeholders to make sure the reporting requirements were met, to ensure users across the organisation would be able to benefit from the new reporting system and layout
Power BIWritten by

Published on
The Challenge
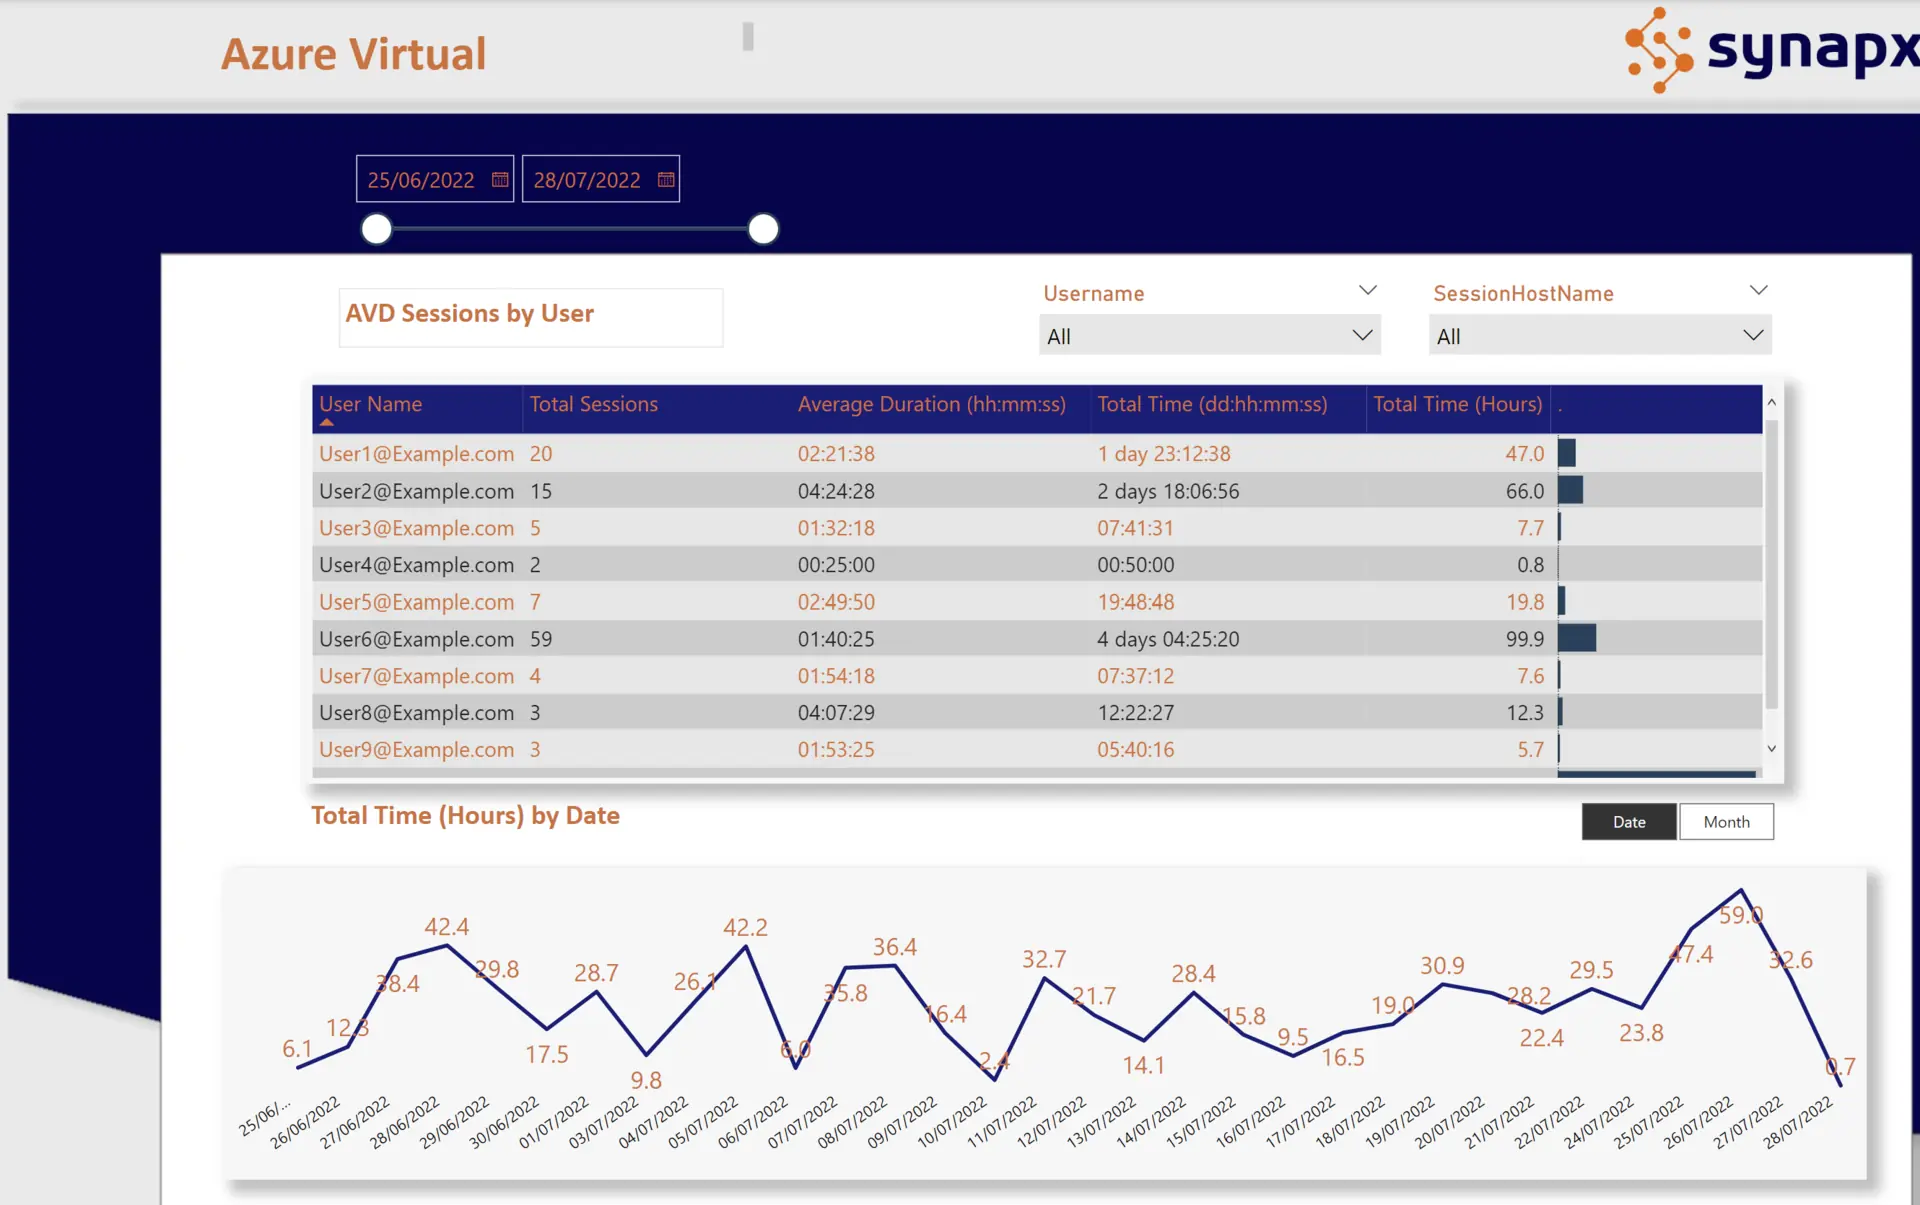
During the COVID-19 pandemic, our client’s working model changed drastically to a virtual/working from home model, and as a result, were using Microsoft Virtual Desktop to access the company network. Our client wanted to report on user interaction with the Virtual Desktop application to further understand user working patterns and engagement. The requirements were:
- Provide analysis on users’ login frequency.
- Duration of access.
- Unique connections per day.
- Analysis on top 3/lowest 3 user logins per week.
- Automated alerting where there were no connections within a period of time.

Our Approach & Solution
Our client was already subscribed to a Microsoft E5 license, of which Power BI Pro is included. Using the integration functionality between Azure Log Analytics workspace and the Power BI cloud, we developed a fully automated solution that extracted data from Azure into Power BI allowing us to present this information in a professional dashboard for our clients senior stakeholders. Simple buttons, filters and visuals were applied to present the information in the most logical way for the consumers of the report. Using Power BI subscriptions, we were able to send daily emails to prescribed users that provided a snapshot of daily KPIs.
The Outcome
Our client was already subscribed to a Microsoft E5 license, of which Power BI Pro is included. Using the integration functionality between Azure Log Analytics workspace and the Power BI cloud, we developed a fully automated solution that extracted data from Azure into Power BI allowing us to present this information in a professional dashboard for our clients senior stakeholders. Simple buttons, filters and visuals were applied to present the information in the most logical way for the consumers of the report. Using Power BI subscriptions, we were able to send daily emails to prescribed users that provided a snapshot of daily KPIs.