Power BI - Jira Service Desk
The Company is a Microsoft Gold Partner and provides tailored outsourced technology services for the financial sector. For more than a decade, they have been exclusively focused on the demands of this particular sector allowing them to become a true specialist. Every one of their clients is FCA-regulated, and that gives us a unique insight into the importance of high-performing, secure and innovative technology required to best support them.
The company supports financial organisations in their adoption of the Cloud and appreciates the scrutiny faced and the demands of regulatory compliance, particularly in the context of outsourcing risk and public cloud (Microsoft Azure).
Power BIWritten by

Published on
The Challenge
We were approached by the client who had recently implemented Jira Service Desk within their organisation and had aspirations of achieving SDI (Service Desk Institute) Accreditation driven by the Service Management team.
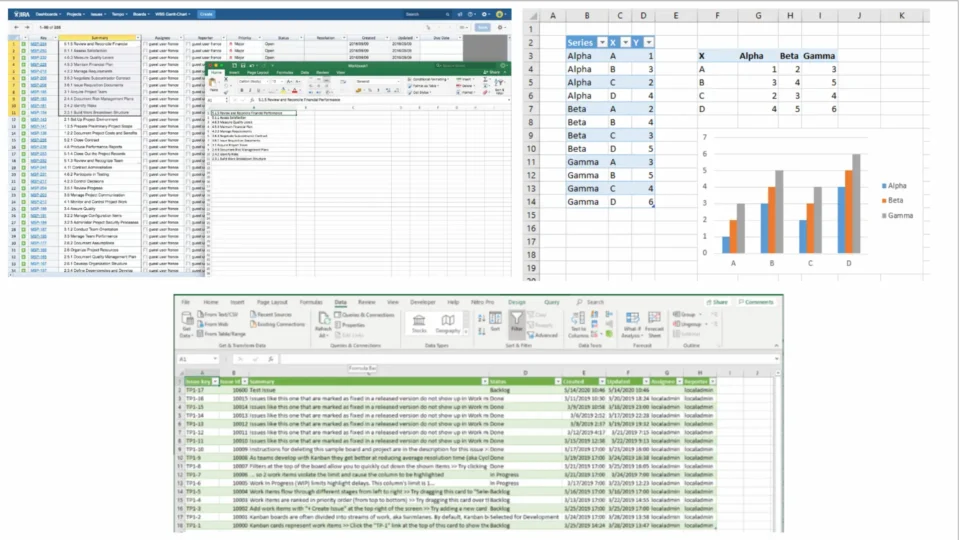
The Client had active Power BI Pro licences and wanted to explore the possibility of replacing their existing reporting process, which was produced manually by exporting a CSV extract of Jira Issues into Excel and distributing to clients in a PDF presentation pack, with a low maintenance, automated solution. The client also had aspirations of sharing the report to their clients over the web, allowing self service and anytime access.

Our Approach & Solution
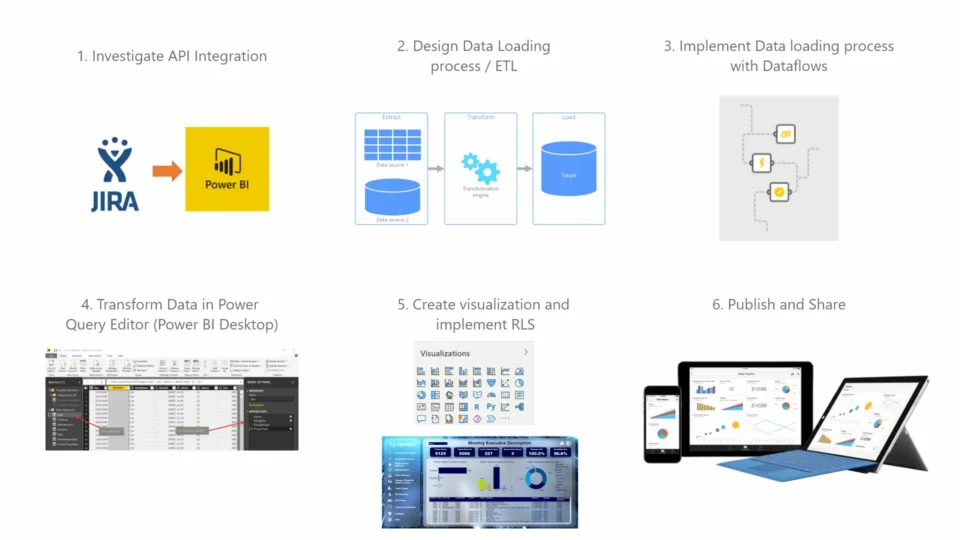
Leveraging the AIO Jira for Power BI plugin, we designed a suitable data connection between Jira and Power BI service with the use of Power BI Dataflows. Dataflows schedule a pull of data from a data source into the Power BI cloud, and depending upon licensing, this can be done multiple times per day. Within a Power BI Dataflow, we transformed the data to ensure it was suitable for Reporting. This involved the use of Power Query Online and the advantage of doing transformation in the Dataflow is that all future reports can leverage all of this work!
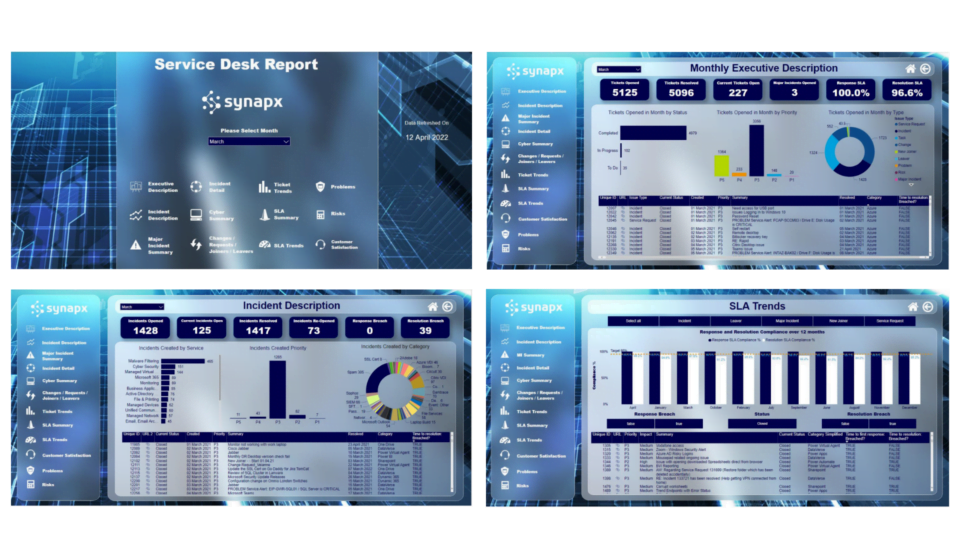
Once the data was in Power BI Desktop, we developed a simple model (Fact table with multiple Dimension tables) which would allow for RLS (Row-Level-Security) to filter data by the Client. Finally, we worked on delivering the specific KPI requirements in the Visualisations tab of the Report working closely with the Service Delivery Management Team.

The Outcome
Leveraging the AIO Jira for Power BI plugin, we designed a suitable data connection between Jira and Power BI service with the use of Power BI Dataflows. Dataflows schedule a pull of data from a data source into the Power BI cloud, and depending upon licensing, this can be done multiple times per day. Within a Power BI Dataflow, we transformed the data to ensure it was suitable for Reporting. This involved the use of Power Query Online and the advantage of doing transformation in the Dataflow is that all future reports can leverage all of this work!
Once the data was in Power BI Desktop, we developed a simple model (Fact table with multiple Dimension tables) which would allow for RLS (Row-Level-Security) to filter data by the Client. Finally, we worked on delivering the specific KPI requirements in the Visualisations tab of the Report working closely with the Service Delivery Management Team.


